Hypertable setup
Turn Ignition's history table into a TimescaleDB hypertable, add compression and retention, tune it, and switch history back on.
Run the SQL on the database host, connected to the tsdb database as a superuser. This must come after Ignition setup: the table sqlth_1_data has to exist, and the history provider must be disabled while you convert it.
The select must show the few samples Ignition wrote earlier. If it says the table does not exist, go back to Ignition setup, step 4.
1. Convert the table to a hypertable
SELECT * FROM create_hypertable('sqlth_1_data','t_stamp', if_not_exists => True, chunk_time_interval => 86400000, migrate_data => True);
t_stampis the time column. Ignition stores it as a number: milliseconds since 1970.chunk_time_interval => 86400000is 24 hours in milliseconds, so Timescale starts a new chunk (a small internal table) every day.migrate_data => Truemoves the existing rows into chunks. This can take a while on a table that already holds a lot of data, and Tiger Data's blog warns that it locks the table while it runs. Convert before the table fills up.
Choosing the chunk size
Tiger Data recommends sizing chunks to hold about 1 to 20 million rows each. Their examples: 1 day (86400000) for 10,000 tag values per minute, and 1 hour (3600000) for 300,000 tag values per minute. The goal is chunks small enough that a time-range query touches only a few. The lab's 12 tags once a second wrote about 1 million rows a day, so one day was a fair choice. Count your own rows per day before settling on 86400000.
Two warnings are harmless: stringvalue is character varying (Timescale prefers TEXT) and datevalue is timestamp without time zone (it prefers TIMESTAMPTZ). Ignition owns that table layout, so leave them. A NOTICE that data is migrating to chunks is normal. The result row created = t confirms the hypertable exists.
2. Turn on compression
ALTER TABLE sqlth_1_data SET (timescaledb.compress, timescaledb.compress_orderby = 't_stamp DESC', timescaledb.compress_segmentby = 'tagid');
This groups compressed data by tag (tagid) and sorts it newest first, which suits trend queries for one tag.
3. Tell Timescale what "now" is
Policies decide which chunks are old enough to act on, and they need the current time in the same units as the table's time column. Tiger Data explains it the same way: t_stamp is a Unix time in milliseconds, not a PostgreSQL timestamp, so automated jobs "work out the age of each chunk relative to the current time" and must be told how to read "now". A number-based time column has no built-in clock, so give it one: a small function that returns the current time in milliseconds.
CREATE OR REPLACE FUNCTION unix_now() returns BIGINT LANGUAGE SQL STABLE as $$ SELECT (extract(epoch from now())*1000)::bigint $$;
The empty result with one row is normal. Per the PDF, policies that act on chunks of a certain age need this function on a table with a number-based time column, so do not skip it.
4. Add the compression and retention policies
Two background jobs keep the database small:
- Compression compresses a chunk once all of it is older than the age you set.
- Retention drops a chunk once all of it is older than the age you set. Dropping is permanent.
Both ages are in milliseconds, because the time column is. Because chunks are 24 hours long, the jobs act on whole days at a time. Keep the retention age longer than the compression age.
| Age | Milliseconds |
|---|---|
| 7 days | 604800000 |
| 30 days | 2592000000 |
| 31 days | 2678400000 |
| 365 days | 31536000000 |
| 366 days (one year, as in the PDF) | 31622400000 |
Choose one of the two sets below. Both come from the lab documents. Tiger Data's guide uses 7 days (604800000) for compression and 365 days (31536000000) for retention, which sits between the two.
Do not copy the INTERVAL examples from Tiger Data's blog
The blog post shows add_compression_policy('sqlth_1_data', INTERVAL '7 days') and add_retention_policy('sqlth_1_data', INTERVAL '1 year'). Tiger Data's guide page says that because t_stamp is an integer column, these arguments must be a number of milliseconds instead, and the blog does not set up the "now" function from step 3. This guide follows the guide page and the PDF: milliseconds, after set_integer_now_func.
The Setup PDF uses this for a historian with a one-year retention policy: compress after 31 days, keep 366 days.
Each call returns a job number, for example 1000 for compression and 1001 for retention. Only one retention policy can exist per hypertable.
Enterprise licence not needed
The first version of this guide used add_compress_chunks_policy and add_drop_chunks_policy, and said automatic dropping needed the enterprise edition. That is no longer true: add_compression_policy and add_retention_policy replace them, and the old fallback of running drop_chunks from your own schedule is not needed.
Choose when the jobs run
By default each job starts one interval after the previous start, so the time of day drifts. A fixed schedule makes them run at a set time every day. First look up the job numbers, because yours may not be 1000 and 1001:
SELECT job_id, proc_name, schedule_interval, scheduled, fixed_schedule, next_start FROM timescaledb_information.jobs WHERE hypertable_name = 'sqlth_1_data';
Then set a start time for each. This example runs retention every day at 20:10 and compression 5 minutes after, in the UTC-6 time zone. Use your own job numbers, dates and time zone.
SELECT alter_job(1000, fixed_schedule => true, initial_start => '2024-02-08 20:15:00.000000-06', next_start => '2024-02-09 20:15:00.000000-06');
SELECT alter_job(1001, fixed_schedule => true, initial_start => '2024-02-08 20:10:00.000000-06', next_start => '2024-02-09 20:10:00.000000-06');
With fixed_schedule set to true the job runs on the clock, every interval from its set start. With false the next run is the last finish plus the interval.
Check the jobs, and check them again after the first run
SELECT job_id, application_name, schedule_interval, retry_period, scheduled, fixed_schedule, config, next_start, hypertable_name FROM timescaledb_information.jobs WHERE hypertable_name = 'sqlth_1_data';
Both jobs must show scheduled = t. After the first scheduled run (next day), check the statistics. last_run_status must be Success and total_failures must be 0:
SELECT job_id, last_successful_finish, last_run_status, job_status, next_start, total_runs, total_failures FROM timescaledb_information.job_stats WHERE hypertable_name = 'sqlth_1_data';
5. Indexes, reindex and autovacuum
Add a BRIN index
A BRIN (Block Range INdex) is a very small index that works well on data written in time order, which is how a historian writes. It is what keeps queries fast as the table grows to tens or hundreds of GB.
CREATE INDEX sqlth_1_data_tagid_t_stamp_brinx ON sqlth_1_data USING BRIN (tagid, t_stamp) with (pages_per_range=64, autosummarize = on);
List the indexes:
There are now three. sqlth_1_data_pkey (on tagid, t_stamp) and sqlth_1_datat_stampndx (on t_stamp) were created by Ignition, and the BRIN index is yours.
Optional, and not verified here: disabling the t_stamp index
The PDF disables the second Ignition index to save space, by editing the system catalog directly:
This edits PostgreSQL's own tables, so it is a superuser-only shortcut. The PDF then runs REINDEX straight after, and a reindex rebuilds invalid indexes, so this step may be undone. If you use it, check indisvalid for that index after the reindex. If you are unsure, skip it.
Reindex the table
It reports each index on each chunk as it rebuilds it. Finish with the single word REINDEX.
See the index working (optional)
This needs some history to have built up. Replace the time range with timestamps (in milliseconds) that exist in your data:
EXPLAIN (ANALYZE) SELECT * FROM public.sqlth_1_data WHERE tagid = 1 and t_stamp between 1707524933560 and 1708525044573;
Look for Bitmap Index Scan on …_sqlth_1_data_tagid_t_stamp_brinx in the plan. In the lab that query returned about 25,000 rows in 23 ms.
Tune autovacuum for this table
A historian writes constantly, so tell PostgreSQL to clean and analyse this table more often than the default:
ALTER TABLE sqlth_1_data SET (autovacuum_enabled = on, autovacuum_analyze_scale_factor = 0.01, autovacuum_vacuum_scale_factor = 0.05, autovacuum_analyze_threshold = 500, autovacuum_vacuum_threshold = 1000);
Leave psql with \q, then exit to return to your own account.
6. Turn history back on
On the Ignition Gateway:
-
Go to Config, Tags, History,
TIMESCALEDBand re-enable the provider.
Fig. 14. The provider is enabled again: Enabled true, status Running. -
In the Designer, open the project and enable history on all the remaining tags with Storage Provider
TIMESCALEDBand Historical Tag GroupTimescale. For real tags, use the storage provider and tag group you actually want.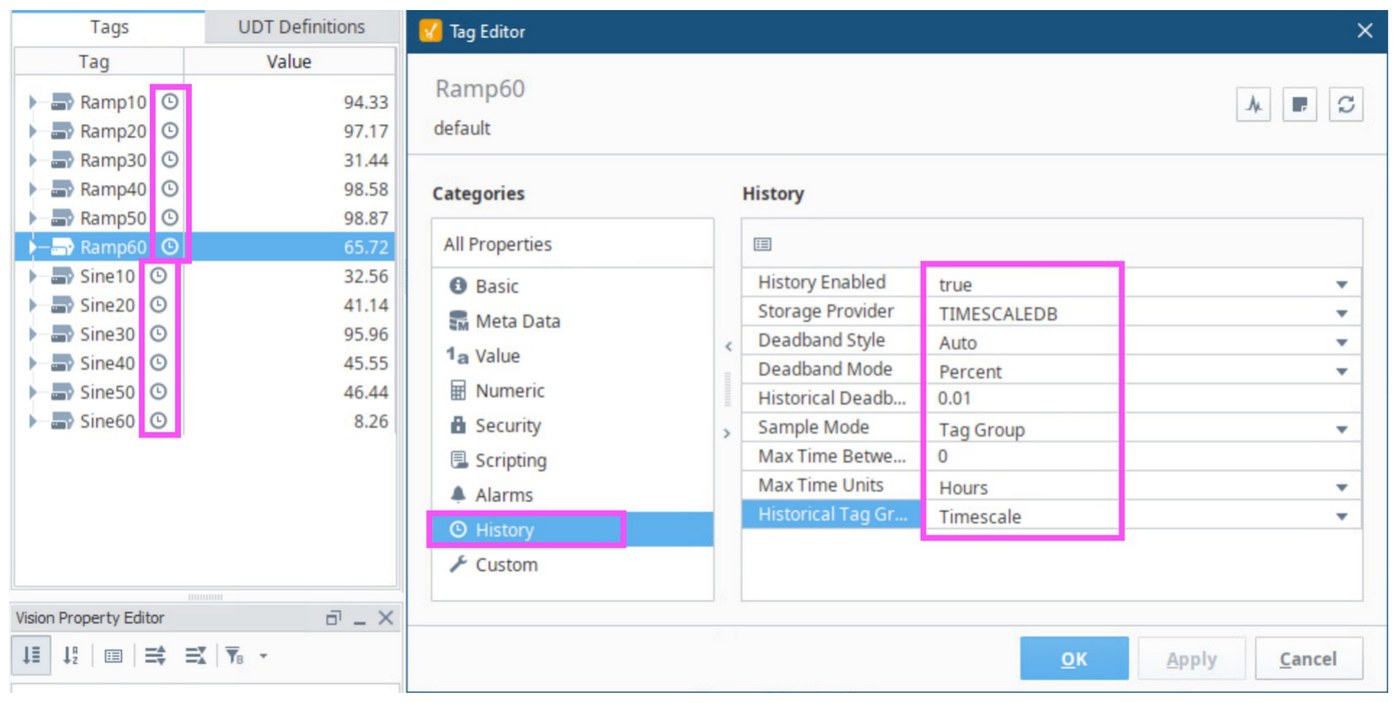
Fig. 15. The History settings, with the clock icons in the Tag Browser showing which tags have history on. -
Check that data arrives: a Vision startup page with an Easy Chart, or a similar trend, shows the history of all 12 test tags. The PDF used the Ad Hoc Trends component by Matthew Raybourn from the Ignition Exchange. Open the project in the Vision Client Launcher to see it.
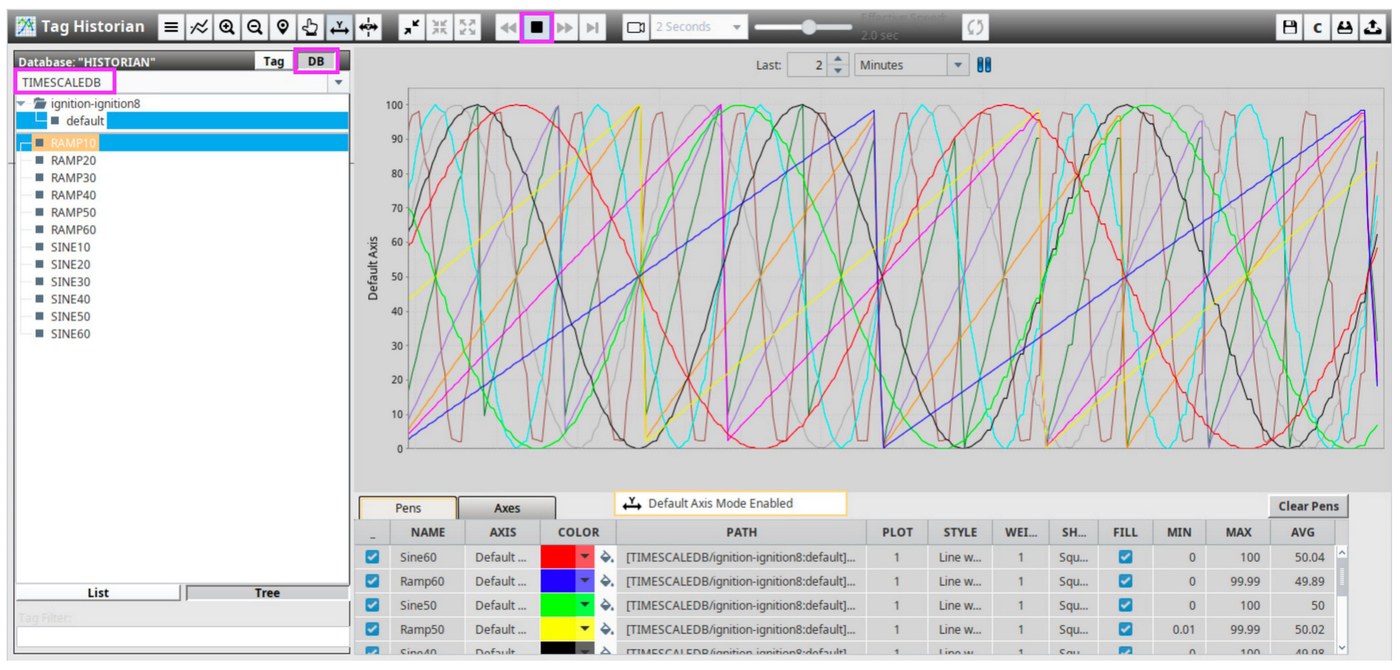
Fig. 16. Near-real-time trending of all 12 simulated tags from TimescaleDB.
Next: maintenance queries, including the check of the first scheduled job run.
Newer TimescaleDB versions
Everything above was tested on TimescaleDB 2.13.1. Check which version you have:
From version 2.18, Timescale renamed compression to columnstore ("hypercore"). The old compression functions are deprecated, not removed, and Timescale's documentation says they remain supported, so this guide's commands still work. For new work you may want the new names:
| This guide (2.13) | Newer name |
|---|---|
add_compression_policy() |
add_columnstore_policy() |
timescaledb.compress |
timescaledb.enable_columnstore |
timescaledb.compress_segmentby |
timescaledb.segmentby |
timescaledb.compress_orderby |
timescaledb.orderby |
Tiger Data's current Ignition guide uses the newer names. For the same table, with a 7-day columnstore policy and a 365-day retention policy, it gives:
ALTER TABLE sqlth_1_data SET (
  timescaledb.enable_columnstore = true,
  timescaledb.segmentby = 'tagid',
  timescaledb.orderby = 't_stamp DESC'
);
SELECT add_columnstore_policy('sqlth_1_data', after => 604800000);
SELECT add_retention_policy('sqlth_1_data', drop_after => 31536000000);
Their page has no date or version, so check that your TimescaleDB has these names before using them. The same page also applies to Tiger Cloud, Tiger Data's managed service, and says the steps are the same for a self-hosted TimescaleDB.
Things to know if you are on a newer version:
- From 2.20 the compression job is listed as Columnstore Policy, so the
proc_namein the job queries above reads differently. - A GitHub issue reports a setup script on version 2.21 failing with "columnstore not enabled" (issue #8600). Keep the order used in this guide:
ALTER TABLEfirst, the policy after. - The deprecation notice said the old names would go in a later major release. Read the
add_compression_policypage and theadd_columnstore_policypage for your version before you rely on either.
Sources for this section: timescaledb pull request 7443 (the renamed functions and settings), the two documentation pages above, and the timescaledb-python update notes.
Tiger Data, the company behind TimescaleDB, publishes an integration guide and a blog post (17 April 2026) with the same core steps: disable partitioning, convert sqlth_1_data with a millisecond chunk interval, set the "now" function, then add compression and retention. Neither covers the BRIN index, reindex, autovacuum or the maintenance queries, which come from the PDF only.